Valentine's day surprise
Perception of the month - February 2020

PoM - Perception of the month
The perception of the month Blog Posts are back to inform you about the newest developments, market solutions, interesting applications and fun facts about the hyperspectral community.
In our new monthly blog we will try to explain the hyperspectral world to you. The blog will appear each month around the 15 of the month.
Every month we will think about real life problems, innovative ideas and interesting experiments which we want to share and solve with our community. This blog is intended to enlighten, inform and surprise. Feedbacks and evaluations are welcome.
#PoM - Valentine's Day surprise
The Valentine's Day
The Valentine's Day, or Saint Valentine's Day, is celebrated annually on February 14. Originating as a feast day honoring one early saint named Valentinus. Through the centuries it became a significant cultural, religious, and commercial celebration of romance and romantic love in many regions around the world. The association with romantic love came in the 14th century. In the 18th century in England, it grew into an occasion in which couples expressed their love for each other by presenting flowers, offering confectionery, and sending greeting cards.
Flashback to 2013
In February 2013 we already showed you the difference between REAL roses and PFC (plastic) roses in hyperspectral imaging.
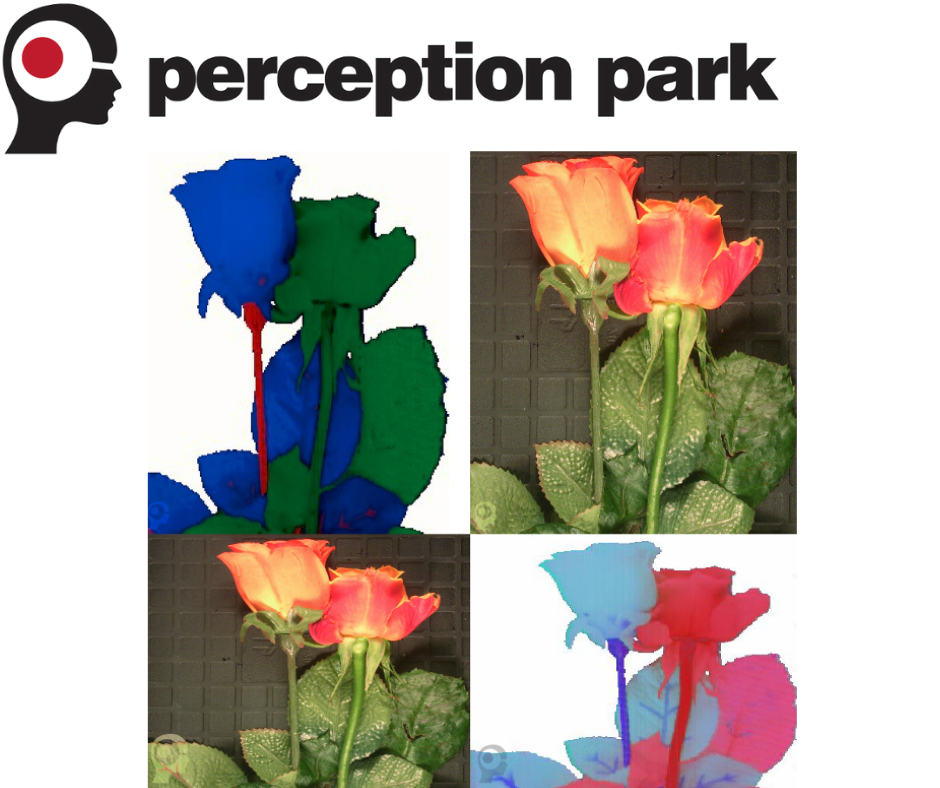
But this year we would like to jump back to the good old days when the Valentine's Day was feast day. This in mind we decided to analyze chocolate bars from Lindt.
What we do this year
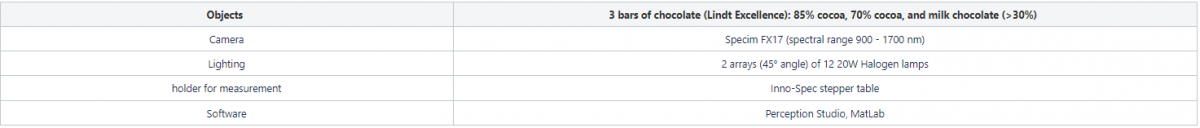
We prove that we can see the different concentrations of cocoa. To solve this issue we bought three commercially available bars of chocolate - Lindt Excellence.
In hard work we were able to make chocolate hearts out of the bars.

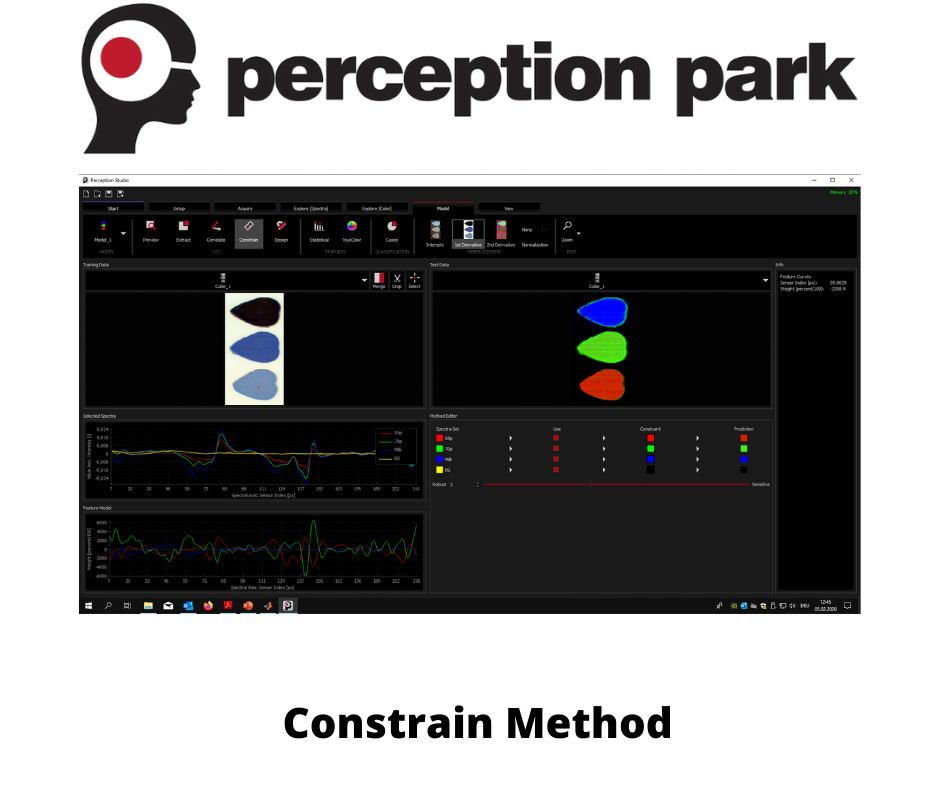
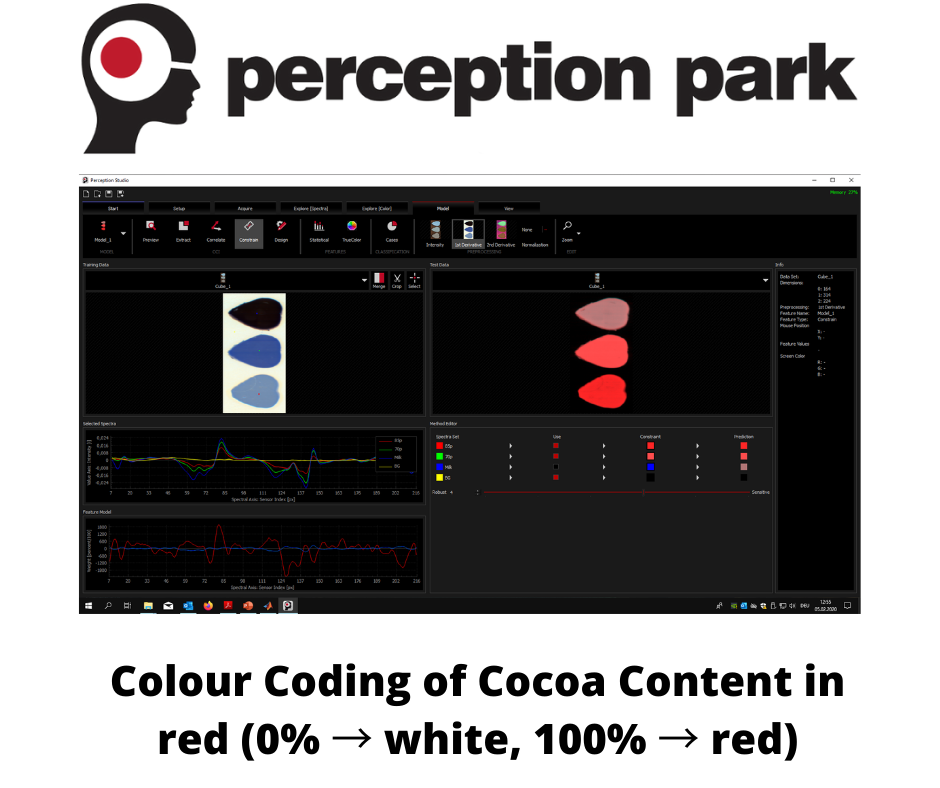
We choose to take three bars of chocolates with 85%, 70% cocoa and milk chocolate. This Lindt chocolate hearts were used to create a color-coded hyperspectral model to determine the cocoa content in the chocolates.
The resulting image is imported into Matlab where it is segmented and the objects are eroded (morphological operation to exclude the noisy edges).
The overall color of the objects is then transformed back into cocoa content.


Measurement Description
Required Instruments for measurement
Conclusion
The recorded cocoa content in the three chocolate bars
 Creating the model with only 2 values, which are close together, leads to the error of ~4%.
You want more information?
For all those who want to know more about - how to detect the amount of cocoa powder - we share with you this interesting paper.
Rapid fraud detection of cocoa powder with carob flour using near infrared spectroscopy / Maribel Alexandra Quelal Vásconez ... et al.
Follow us for more Information
If you want to get further detailed Information about the hyperspectral community follow us on
![]()
![]()
Perception Park wishes a happy and informative
Valentine's Day!
![]()
related articles


Follow Us


© Perception Park - The Chemcial Sensing Company 2024