Machine Vision Bridge


Perception System - Industrial Hyperspectral Imaging and Chemical Color Imaging


A Machine Vision Bridge is a data processing unit that acts as an adapter between a hyperspectral camera and a machine vision system.

By means of Chemical Color Imaging, users can handle hyperspectral technology, develop hyperspectral applications and process spectral data by their well-established machine vision system. Thereby spectroscopic data are recorded, standardized, processed and information of interest is output as interpretable information via standard image format to a machine vision system.

The user configures the Perception System according to application relevant needs. The Perception System is available based on different hardware. For in-line purposes like sorting the Perception System “Industry” is highly recommended. Here the Perception System is based on a 19” industrial PC with high performance GPU’s that allows to calculate up to 150 million spectral points per second with a latency of 1ms.

Hyperspectral data processing – Functional Modules:


The following illustration allows an overview based on an abstraction through functional modules.


Instrument Abstraction

Dependent on the acquisition technology, data are provided by the instrument (camera) in different formats. This functional module makes an instrument compatible by abstraction of its acquisition technology.


Instrument Standardization

Interferences caused by the acquisition technology are suppressed and hyperspectral data are corrected. These disorders are depending on the chosen instrument hardware. Such disorders could be:

  • read-out noise
  • dark current noise
  • defect pixels
  • wavelength calibration
  • ...


Disturbing Influence Suppression

Interferences like the non-uniformity of illumination, which are caused by the measuring setup, are suppressed and data are corrected with regards to application relevant needs.


Hyperspectral Pre-processing

Application of typical (scientifically and industrially established) pre-processing methods to hyperspectral data like filtering, derivative, normalization, etc.


Hyperspectral Feature Extraction and Operation

By Hyperspectral features, information hidden in a spectral curve is described by a single value per pixel. This process leads to dimensional reduction e.g. from a 3 dimensional hyperspectral cube to a 2 dimensional feature image.

Advantages:

  • The description of information by feature values is more specific and more understandable compared to investigation into a spectral curve.
  • Feature operation often leads to the calculation of new (dependent) features as a function of base features. Often the result is a decision or a class-information like: “spectra are oversteered” or “a spectrum is similar to a referenced material”.


Output Interfacing

Information gained per object pixel is prepared to be compliant to machine vision standard formats.
Supported information formats are:

  • Color information (3 values per object pixel)
  • Multiple feature information (n values per object pixel)
  • Decision information (1 value per object pixel)


+ -

Why should I use Chemical Color Imaging?


SHORT DEVELOPMENT TIMES

Till now every application based on hyperspectral imaging had to be developed from scratch and subsequently coded into dedicated data processing software. This process is time consuming and ties up resources.

A Perception System has encapsulated most processing methods that are known to be well suited for real time hyperspectral imaging in industry. Our customers don’t have the need to develop a data processing system for each application. Instead they are able to configure a Perception System within incredibly short time.


TO BE INTEGRATED INTO EXISTING IMAGE PROCESSING SYSTEMS

By using a Perception System hyperspectral cameras can be integrated into the image processing system of your machinery which then is used to classify according chemical properties.


SHORT TIME TO MARKET AND QUICK ROI

By using a Perception System you can use your existing machinery with your existing machine vision system to provide your customers with new solutions, e.g. sorting solutions based on chemical material properties, within a few months.

Due that a Perception System is intuitive configurable by everybody you have very short times to market and consequently a quick return on investment for your unique machinery.

+ -

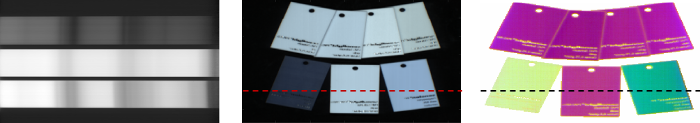
Chemical Color Imaging vs Hyperspectral Imaging


Chemical Color Imaging vs. Hyperspectral Imaging

To develop applications based on hyperspectral cameras it was usually necessary to seek advice from experts of chemometry and spectroscopy. - Till now! By Chemical Color Imaging hyperspectral cameras are integrated into existing image processing systems. By intuitive configuration options, chemical properties are extracted using established chemometric methods. By combining three properties, a color impression (representing chemical relations information) is generated which is simple to understand and can be processed by image processing methods.

The resulting Chemical Color Image of a scene shows object properties in Chemical Colors which do not represent the physical property color. Instead objects with similar molecular structure are represented by similar colors; different objects by different colors.


chemical imaging, chemical color imaging, machine vision, plastic sorting

Center: CCI-preview of different plastics; right: Chemical Color Image of different plastics. The Chemical Colors correlate with the molecular structure of the samples. The dashed line marks the moment of record shown in the left handed image; Left: Hyperspectral image at a specific moment. Spectral information is shown horizontally and spatial information is shown vertically.

+ -

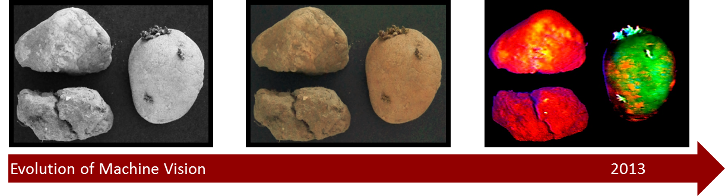
Chemical Color Imaging - Proof of Concept


Perception Park, chemical imaging, chemical color imaging,  hyperspectral imaging, spectral imaging, Rosinen, raisins, raisin sec, la pasa, uva pasa, uva passa, uvetta, zibibbo, passa de uva, rodzynek, rodzynka, изю́м, изю́минка, кишми́ш, 葡萄干, 葡萄乾, pútáogān, 烹, kuru üzüm


TheChemical Color Image on the left shows raisins with impurities in between (paper, plastic). The blue and green arrows point two spectral positions of raisins. In the graph on the right it can be seen that points with similar color also have similar spectra behind. The red arrow points a different color. Consequently the spectrum (paper) is also different from the raisin spectra.

+ -